Warning* This culminating activity is not placed online with the intent that you will stay home and complete the activity rather than attending class and completing the activity. It is placed online so that you can use the resource in class or plan from home after class or on the weekend. I must have seen your planning and implementation process.
A culminating activity is like an in class exam .... therefore you must do it in class in order for me to accept your work as your own. If you are absent during the culminating week which is Jan. 18 - 22 you must provide a medical note excusing your absence.
If you skip class to work on complete your project and then try to submit it, your submission will be rejected and you will receive a 0 on your Culminating Activity, which is valued at 15% of your entire mark.
|
| ||||
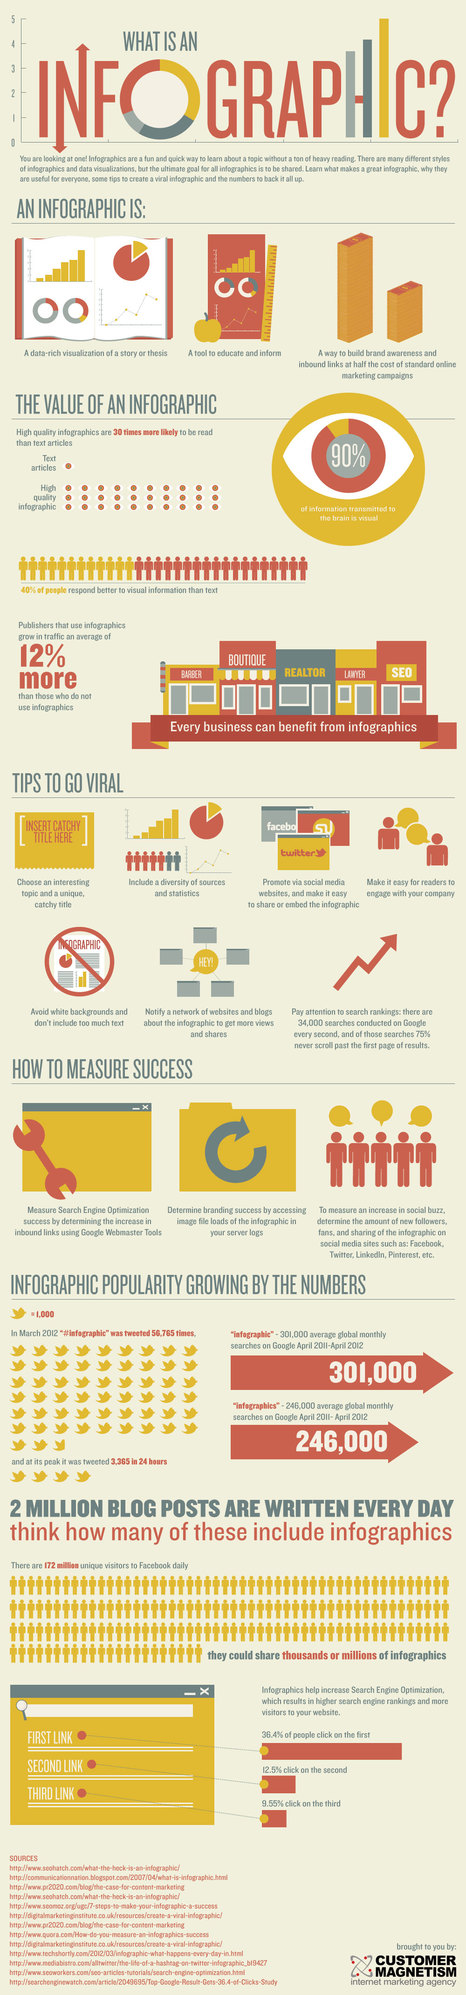
Infographic From Wikipedia, the free encyclopedia
"Information graphics or infographics are graphic visual representations of information, data or knowledge intended to present information quickly and clearly.[1][2] They can improve cognition by utilizing graphics to enhance the human visual system’s ability to see patterns and trends.[3][4] Similar pursuits are information visualization, data visualization,statistical graphics, information design, or information architecture.[2]
Infographics have evolved in recent years to be for mass communication, and thus are designed with fewer assumptions about the reader's knowledge base than other types of visualizations."
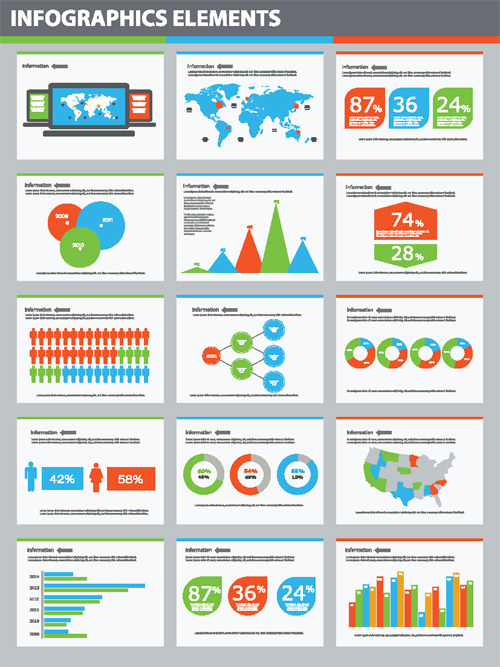
So.... how the heck do I do this anyway? AKA Free resources for creating Infographics:
There are a growing number of free resource tools for creating Infographics available online and they continues to become more available and easy to use as the popularity of infographics grows. Click on the links below to check out the resources and find the best one for you to use for your culminating. Of course you may hand draw your own info graphic but if you are not that savvy and need all the help you can get (like me) these resources are there to help you.
There are a growing number of free resource tools for creating Infographics available online and they continues to become more available and easy to use as the popularity of infographics grows. Click on the links below to check out the resources and find the best one for you to use for your culminating. Of course you may hand draw your own info graphic but if you are not that savvy and need all the help you can get (like me) these resources are there to help you.
|
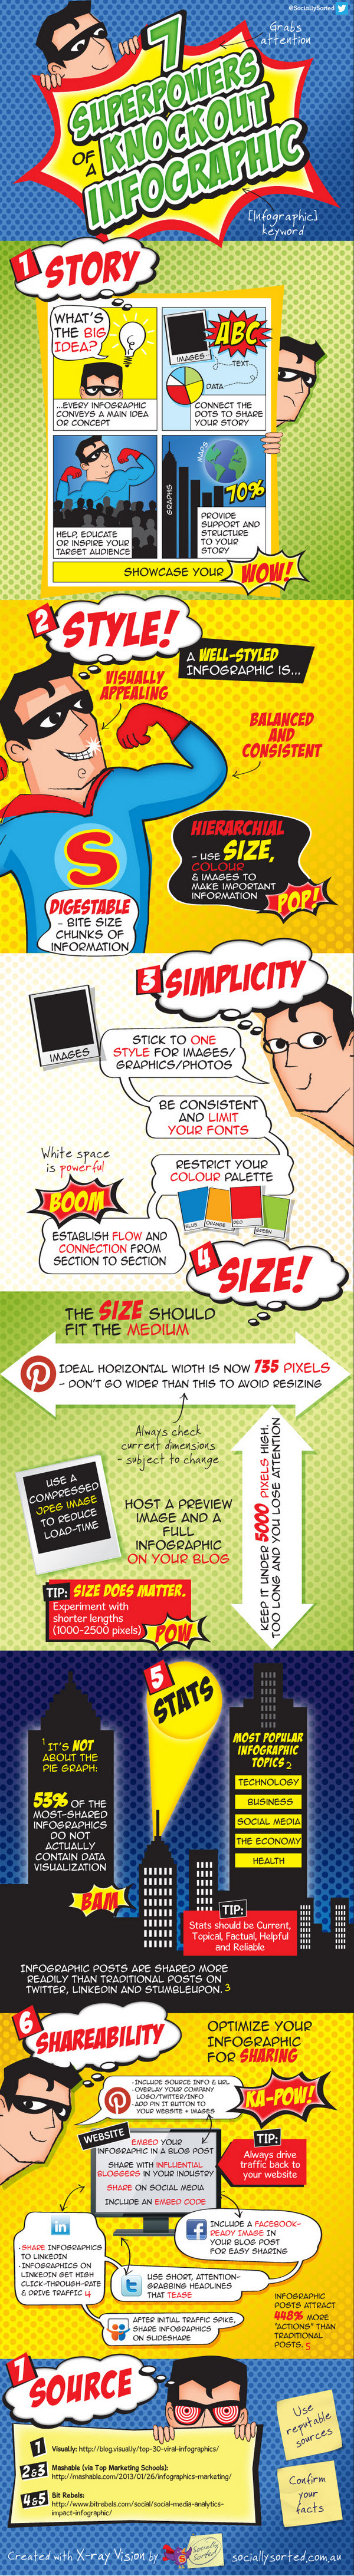
" 5 Tips on creating infographics:
Visual design elements to include in your infographic
|